What actually moves a Pokémon card’s price
We priced every English Pokémon card and tracked 1,409 of them month by month since 2021. Then we checked which signals would have called the last twelve months. The answer: the character matters far more than the artist, and almost nothing reliably predicts which card breaks out next.

Data: PriceCharting sold-listing prices (raw, PSA 9, PSA 10) and Pokémon TCG card metadata, pulled 6 Oct 2026.
The short version
- Character sets the price, not the artist.Adding the character explains 18 points of price variation for modern chase cards; adding the artist explains 2. Mitsuhiro Arita’s premium is −1% once you control for what he drew.
- Old sets rise, new sets fall.Since mid-2021, cards from pre-2017 sets are up 28–73%. Mega-era cards lost 45% in under a year. Older sets beat newer ones in 7 of 8 test windows.
- Hard-to-grade cards carry the upside.When fewer than 5% of graded copies get a 10, a PSA 10 sells for about 40× raw. A high PSA 10 premium was a positive signal in 6 of 8 windows.
- Don’t chase run-ups.Cards that had just risen usually lagged the following year, apart from the 2025 rally.
- The model dodges losers; it doesn’t find winners.3% of its favourite cards fell 30% or more, against 15% overall. Its odds of picking a card that doubled were no better than chance.
- The valuable end barely trades.Two thirds of PSA 10s worth $1,000–5,000 sell less than once a month.
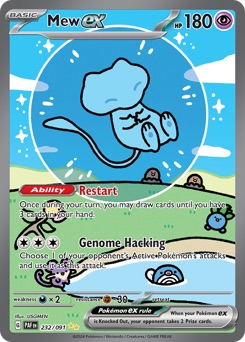

About 19,000 English cards, and nearly all the value sits in a few
The Pokémon Company has printed more than 85 billion cards since 1996, around 10 billion in the year to March 2026 alone. Counted by design rather than by copy, the English catalog is much smaller: our pull covers 18,988 distinct cards across 140 sets, drawn by 390 credited artists. Add printing variants like reverse holo, 1st Edition and Shadowless, and that becomes 36,038 separately priced listings.
The distribution is steep. The median listing trades for $1.55 raw, 41% sell for under a dollar, and the top 1% of listings carry 48% of the catalog’s total raw value. Printing volume explains most of this: half of all cards ever made were printed in the last four years, so modern base cards are effectively bulk, and value pools in short-printed chase cards, older sets and condition.
A long climb with a sharp reset in between
To track the market without letting one $16 million Pikachu swamp everything, each month we took the median price change across every sampled card that traded in both months, and chained those changes into an index starting at 100 in July 2021.
From July 2021 the median chase card slid 23% to a trough in August 2024, then recovered to finish 6% above where it started, +10% over the last year. Holo rares climbed steadily (+32%). Sealed booster boxes and Elite Trainer Boxes nearly doubled (+86%), most of it since early 2025. Plain rares and commons lost 10–19%. Split by era, the picture is sharper. Cards from sets released before 2017 are up 28–73% since mid-2021, led by the 2003–2007 EX era. The median Sword & Shield card is down 31%, the median Scarlet & Violet card has lost 26% since mid-2023, and Mega-era cards released since late 2025 have already lost 45%. New cards keep getting reprinted and opened; old cards have a fixed supply that grading keeps pulling out of circulation.
Where it was printed, how rare it is, and who is on it
We fit a regularized regression of log price on four blocks of facts, adding one block at a time, and scored each step on cards the model did not see (five-fold cross-validation). The added accuracy at each step is that block’s contribution once the earlier ones are known.
Set and rarity alone explain about two thirds of price differences across the catalog. Then character does the heavy lifting: for modern chase cards it adds 18 points, against 2 for the artist. On PSA 10 prices the artist adds even less.
Show the table
A short list of characters, and art styles rather than names
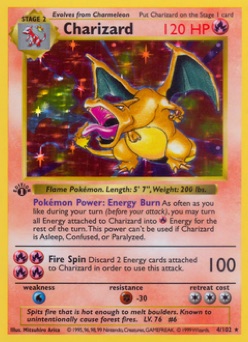
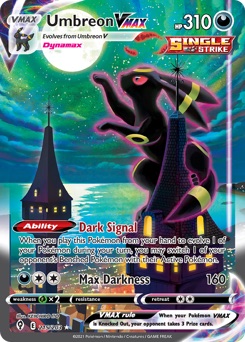
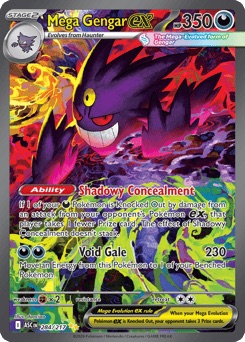
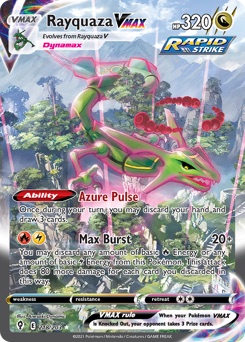
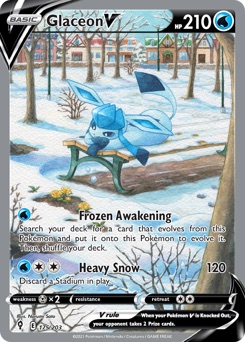
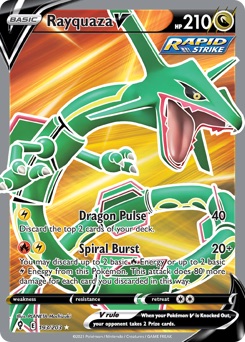
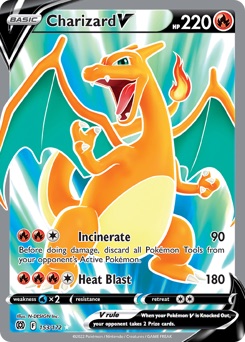
Holding set, rarity and printing variant fixed, the same rarity slot is worth about 12 times more with Charizard on it than with an average Pokémon, and almost as much with Gengar, Umbreon or Rayquaza. The list is stable across eras: the original 151 starters and legendaries, the Eeveelutions, and a few cult favourites like Psyduck and Ditto.
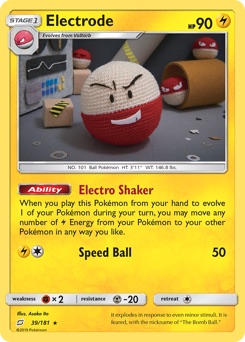
Artists are a different story. Famous names barely register once you control for what they drew. Mitsuhiro Arita, who drew the Base Set Charizard, carries a −1% premium across his 1,328 listings. Ken Sugimori comes in at −10% and Atsuko Nishida at −2%. The premiums that do show up belong to styles: Yuka Morii’s clay sculptures (+183%), Asako Ito’s yarn figures (+412%), Tomokazu Komiya’s offbeat sketches (+116%). Among modern chase cards, illustrators who paint full scenes earn 40–110% over the slot, while studio CGI renders (5ban Graphics, PLANETA, N-DESIGN) sit 50–60% below it.
The pattern behind the record sales agrees. The $8.4 million “Raincoat Pikachu” sold in September was drawn by a fan who won a 2015 contest. Buyers pay for the character, the scarcity and a look you can spot across a room, not for the signature.

A little, and mostly from the obvious
This is the test that matters for finding breakout cards. We trained a model on what was knowable at the end of September 2024 (price, recent momentum, how much a PSA 10 costs relative to raw, volatility, set age, tier, era, and character and artist scores built from that month’s prices only) to predict the next 12 months. Then we froze it and scored it on September 2025 → September 2026, a year it never saw. Both windows use complete months only. 849 cards in the training year, 892 in the test year, each priced at $1 or more at the start.
The frozen model ranked cards reasonably well: a rank correlation of 0.36 between its September 2025 call and what happened (a simpler ridge version scored 0.44). The tenth of cards it liked least fell a median 23%; its top four tenths rose 29–43%. But look at where that skill came from. Two plain facts did most of the work in the test year: price level (expensive cards kept rising and cheap ones fell, IC 0.50) and set age (0.39). Price level also worked in the training year (0.35), but from 2022 through 2023 it pointed the other way, and set age was weak in the training year (0.13). The main model did not find breakouts. 10% of its top-decile cards doubled, against 11% of all cards. Its real skill was avoiding losers: 3% of its favourite cards fell 30% or more, against 15% of all cards. The simpler ridge model did better here: 27% of its top tenth doubled. We chose the tree model before seeing results, so we report it as the headline and the ridge result as a hint worth retesting.
Across eight different start months, three signals kept their sign. Older sets beat newer ones in 7 of 8 windows. A high PSA 10 premium over raw, a sign that the card is hard to grade and graded demand is outrunning supply, was positive in 6 of 8. Momentum reversed: cards that had run up over the previous 3 to 12 months usually lagged, until the 2025 rally briefly flipped it. Part of that reversal is likely noise in the price estimates rather than a tradeable effect. The artist score never predicted anything (mean IC 0.01).
Last year’s biggest gainers, and what the model likes now
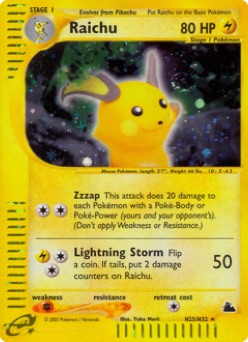
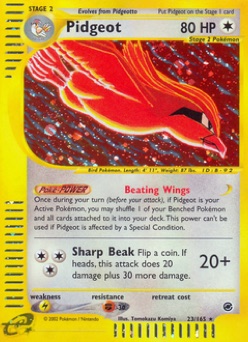
Among cards that started the year at $10 or more, the biggest movers were older chase cards, especially LV.X cards from the 2007–2011 Diamond & Pearl era (Raichu, Palkia G, Torterra) and the 2004 Emerald Rayquaza, which roughly quadrupled. Two thirds of the top 5% of gainers came from sets released before 2011, although those sets were only 26% of the cards tested. The model had several of them in its top fifth beforehand and missed others entirely. The watchlist uses the same model refit on both years. It leans toward what has worked: 2003–2019 chase cards and Wizards-era cards priced roughly $11–110 raw, where a PSA 10 trades at 15 to 700 times the raw price. The list changed noticeably when we moved the window by one month, which is itself a warning: it is a list to research, not a list to buy.
Thin, and thinner as price rises
PriceCharting’s sales counter gives a rough read on depth. A typical card under $500 raw changes hands several times a month or more. Above $500 the median raw card sells about once a month, and 38% sell less often. Graded copies are thinner still: a PSA 10 worth $1,000–5,000 sells about once every three months at the median, and two thirds of them sell less than once a month. Above $5,000 that rises to three quarters. At the valuable end you can look up a price, but you can rarely trade at it.
Grading is where much of the money is made, and it is a lottery on condition. The fewer copies PSA grades a 10, the bigger the gap between a PSA 10 and a raw copy: cards where fewer than 5% of graded copies get a 10 sell for a median 42 times their raw price as a PSA 10, against 8 times for cards where half or more come back gem mint (rank correlation −0.67 across 614 cards).
Who provides liquidity? No one quotes both sides. For physical cards, liquidity comes from dealers and local shops buying at roughly 60–80% of market, TCGplayer buylists, eBay (about $2.6 billion of trading-card sales in 2025, roughly 13% in fees) and auction houses (Goldin, Fanatics Collect, Heritage) for the top end. The closest thing to a market maker is the tokenized vault platforms: Courtyard buys back instantly at about 90% of fair value and Collector Crypt runs a similar buyback. Both fund those bids from the margin on digital pack sales, which is why most on-chain volume is pack openings and buybacks rather than collectors trading with each other.
Liquidity table
Five routes, each with a different risk
| Route | What you hold | Main risk |
|---|---|---|
| Vaulted, tokenized cardsCourtyard (Polygon), Collector Crypt (Solana), Phygitals, Deadstock (Arbitrum) | A redeemable claim on a graded card in a vault | Custodian and platform risk; buyback bids are set by the platform |
| Perpetual futures on card pricesTradeX (up to 20×), Pokeliquid (67+ markets, up to 25×) | A leveraged long or short on a price feed | The feed itself: thin, lagged sales make the oracle easy to move |
| EquitiesNintendo (about a third of The Pokémon Company), eBay (owns Goldin) | Shares of companies that profit from the hobby | Diluted exposure: card prices are a small driver of either stock |
| Platform tokens and fundsCollector Crypt’s CARDS token; MemeStrategy (Asia-based) | A claim on platform fees or a managed basket | Tracks platform volume and sentiment more than card values |
| Index-style basketsNot yet offered as a product | — | The gap: no credible, frequently updated index exists to settle against |
The last row is the opening. Every route above leans on a price, and today’s prices come from scattered sold listings that are days old and a few sales deep. A transparent index of the kind built here, recomputed monthly or faster, is the missing piece for both honest perps and a real market maker.
The four-minute walkthrough
How this was built, and what it cannot tell you
- Catalog and prices. Every English set page on PriceCharting (153 sets, 41,009 products) gave current raw, PSA 9 and PSA 10 prices. Cards were matched to the open Pokémon TCG dataset by set and card number for artist, rarity, species and release date (97% matched; Black Star promos and fast-food promos excluded from the regressions).
- History. 1,409 product pages, drawn as a stratified random sample by rarity tier (the draw never looked at price), gave month-end price history back to late 2020, PSA population counts and recent sales volume. (The first 268 were drawn set by set before the queue was shuffled to stay under PriceCharting’s rate limit.) PriceCharting’s prices are an algorithm over completed eBay and marketplace sales, so month-to-month moves are smoothed. That smoothing can make short-term momentum look stronger than it would be in a live order book.
- Cross-section. Ridge regression on one-hot blocks (set × rarity, variant, species, artist), five-fold shuffled cross-validation, log price. Premiums are the exponentiated coefficients, shrunk toward zero for small groups.
- Backtest. Features at month t only. Character and artist scores are leave-one-out means of price residuals at t, so no future price leaks in. Trained on t = Sep 2024, tested on t = Sep 2025, using month-end prices only (PriceCharting’s newest point is today’s partial-month price, so it is excluded). One test year is one draw from a market that has had a strong run, so the result should be read as weak evidence, not a law.
- Not covered. Japanese and other-language cards (where several record sales sit), grade-specific returns beyond PSA 10, transaction costs (10–15% round-trip on most venues), and the counterfeit and grading-error risk that every physical position carries.
Card images are scans from the Pokémon TCG API, shown small and next to the data they illustrate, for commentary. Pokémon and card artwork © The Pokémon Company, Nintendo, Creatures and GAME FREAK. This research is independent and not affiliated with or endorsed by them.
This is research, not investment advice. Collectibles are illiquid and prices can fall faster than they rose.